Corner Markets and Card Stats: Bettors Turning to Set-Piece Data for Football Edges
Written by Zoe Meier · Jul 19, 2026

Corner Markets and Card Stats: Bettors Turning to Set-Piece Data for Football Edges
Bettors who focus on corners and cards have built strategies around granular set-piece metrics that reveal patterns across matches and leagues, and data from the 2025-26 season shows continued interest in these markets as teams refine attacking routines. Analysts track variables such as corner conversion rates, delivery types, and the frequency of bookings during dead-ball situations because these elements often produce predictable outcomes when aggregated over multiple fixtures. Teams with high possession percentages tend to generate more corners, yet conversion depends on additional factors including delivery accuracy and the presence of tall target players inside the area. Observers note that clubs employing short-corner routines frequently post lower totals, which influences how markets price over-under lines on any given matchday. Card markets follow similar logic since referees issue cautions more often during set pieces when physical challenges occur near the goal or during aerial duels.Key Metrics That Shape Corner Betting
Advanced tracking systems record the number of corners awarded per 90 minutes along with the average distance of deliveries from the corner flag, and these figures help identify teams that consistently create high-danger chances. Researchers at sports analytics firms compile historical datasets that compare corner volume against expected goals from set pieces, allowing bettors to isolate value when bookmakers set totals based on broader averages rather than specific matchups.
One dataset released in early 2026 highlighted how teams in the top European leagues averaged 5.8 corners per game during the previous campaign, yet certain sides exceeded 7.0 when facing defensive blocks that invited pressure. Bettors cross-reference this information with recent form, travel schedules, and weather conditions because rain or wind can alter delivery success and therefore shift expected totals.
Card Markets and Set-Piece Correlations
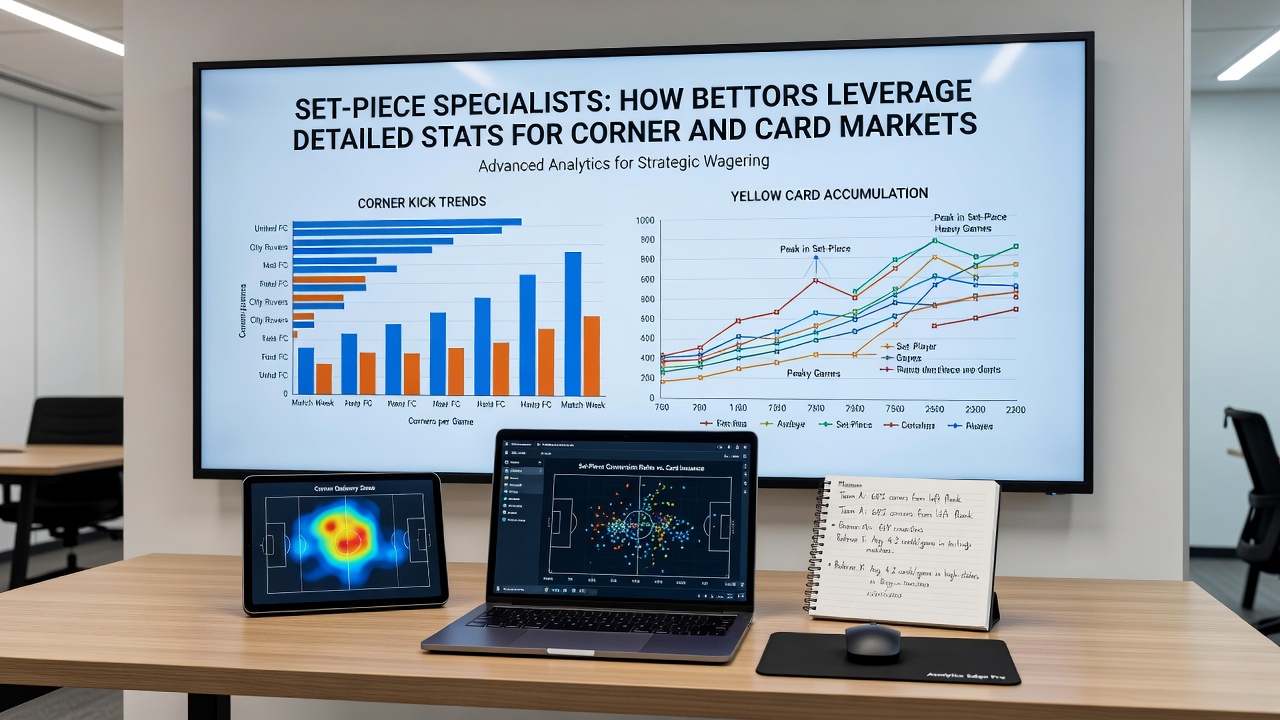
Bookings during corners and free kicks represent another layer of analysis because aggressive defending near the box often leads to fouls that trigger cards. Statistics compiled by Opta show that matches with high corner counts also record elevated card rates when both teams employ man-to-man marking inside the penalty area. Bettors examine player-level data on disciplinary records during set pieces to identify individuals who pick up cautions at above-average rates in those situations.
European regulatory bodies including the Malta Gaming Authority have published industry reports that note growing interest in niche football markets such as cards from set pieces, and these documents indicate operators have expanded live-betting options to accommodate real-time adjustments based on in-game statistics. Academic studies from institutions in Australia further explore referee behavior patterns, revealing that certain officials issue more yellow cards after the 75th minute during matches with repeated set-piece pressure.
Tools and Platforms Bettors Use
Specialized software now aggregates live and historical set-piece data from multiple competitions, enabling users to filter by league, team, and even specific player roles. Platforms pull information from sources such as the Canadian Gaming Association's research archives on sports wagering trends, which document how bettors allocate stakes across prop markets including corners and cards. These tools often include heat maps that display where teams most frequently win or concede corners, together with average card counts per set-piece situation.
Live odds movements become sharper when early corners or cards occur because algorithms adjust lines within seconds of each event, and bettors who monitor these shifts can respond before markets settle at new levels. Data providers supply APIs that feed directly into custom dashboards, allowing rapid comparison of current match statistics against season-long benchmarks.
League-Specific Patterns Emerging in 2026
By July 2026, several leagues displayed distinct set-piece profiles that influenced market pricing. Lower-scoring competitions tended to produce fewer corners but higher card volumes when teams resorted to tactical fouls to break up play, whereas attacking leagues generated elevated corner counts alongside moderate card rates. Bettors who maintain separate models for each competition adjust their stakes accordingly when fixtures cross borders or feature promoted sides with different tactical approaches.
Conclusion
Set-piece statistics continue to supply bettors with measurable inputs for corner and card markets, and the availability of detailed tracking data supports ongoing refinement of these approaches across professional football. As more competitions adopt uniform data standards, the depth of available metrics is expected to increase, giving those who study these areas additional variables to incorporate into their evaluations.