Exploring Shifts in Betting App Usage Patterns During Premier League Matches
Written by Dana Carter · Jun 23, 2026
Exploring Shifts in Betting App Usage Patterns During Premier League Matches
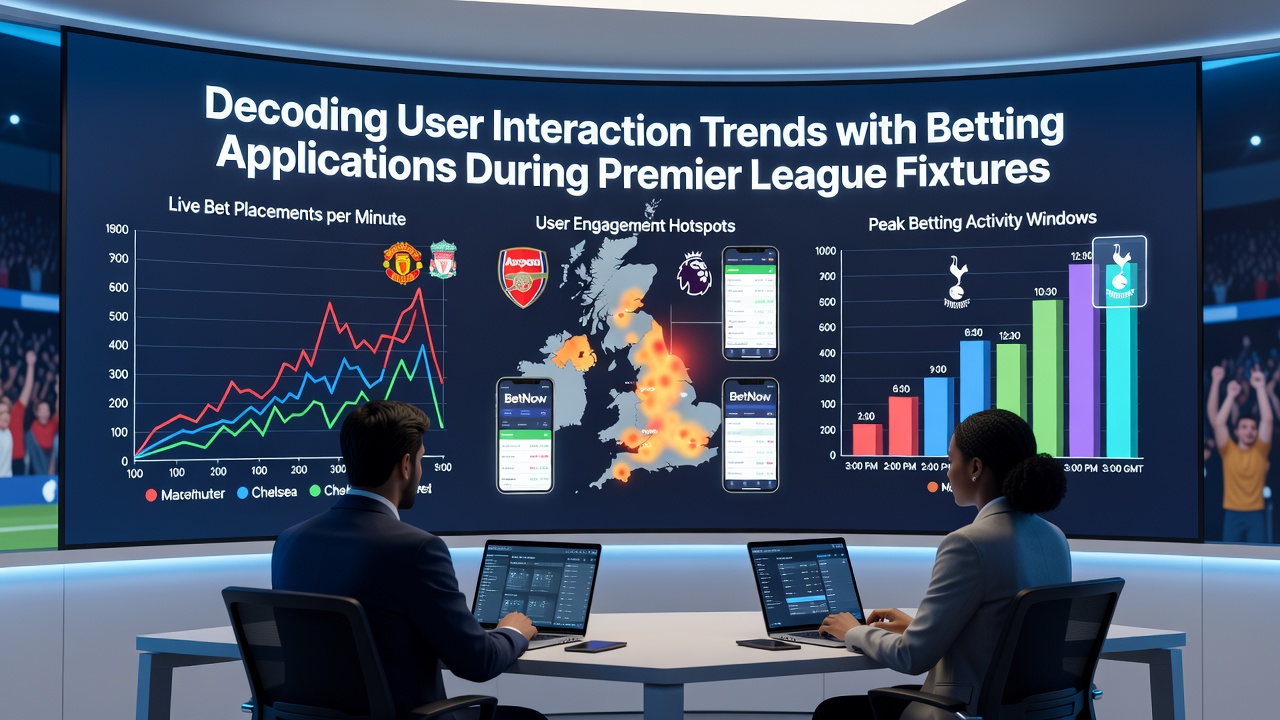
Data from recent seasons shows that user sessions on betting applications spike notably during Premier League fixtures, with peak activity often occurring in the first fifteen minutes after kickoff and again during halftime intervals. Observers note that these patterns emerge because participants frequently check updated odds while matches unfold in real time, and many combine this activity with notifications for goal alerts or card incidents.
Analysts tracking these trends point out that live betting features account for a growing share of total wagers placed through apps, especially in games involving top clubs where scorelines tend to fluctuate. Figures reveal that sessions initiated before matches often extend well beyond the final whistle when users review post-game statistics and settle accumulated bets, creating a continuous engagement loop that differs from pre-match only interactions.
Timing and Frequency of App Interactions
Research indicates that interaction rates climb sharply in the opening half of fixtures, driven by users refreshing odds displays and adjusting stake amounts on markets such as next goal or player performance props. Studies conducted across multiple matchdays in the 2025-26 campaign found that average session duration reached twenty-three minutes during live play, compared with eight minutes for non-match periods, according to aggregated operator telemetry.
What's notable is how these intervals align with broadcast pauses or VAR reviews, moments when bettors appear to switch between the app and the match feed to confirm details before confirming selections. In June 2026, as the season concluded and data sets from the full campaign became available, patterns showed consistent elevation in evening kickoffs versus afternoon slots, likely tied to higher viewership numbers across digital platforms.
Preferred Features and Navigation Paths
Users commonly navigate first to the in-play section upon app launch, followed by quick access to accumulator builders that allow stacking of live outcomes. Data shows that push notification responses lead to immediate session starts in roughly forty percent of cases, with many then proceeding to cash-out options once a partial return materializes. Those who've examined heatmaps of app interfaces report that the live odds ticker receives the highest tap density during high-stakes encounters.
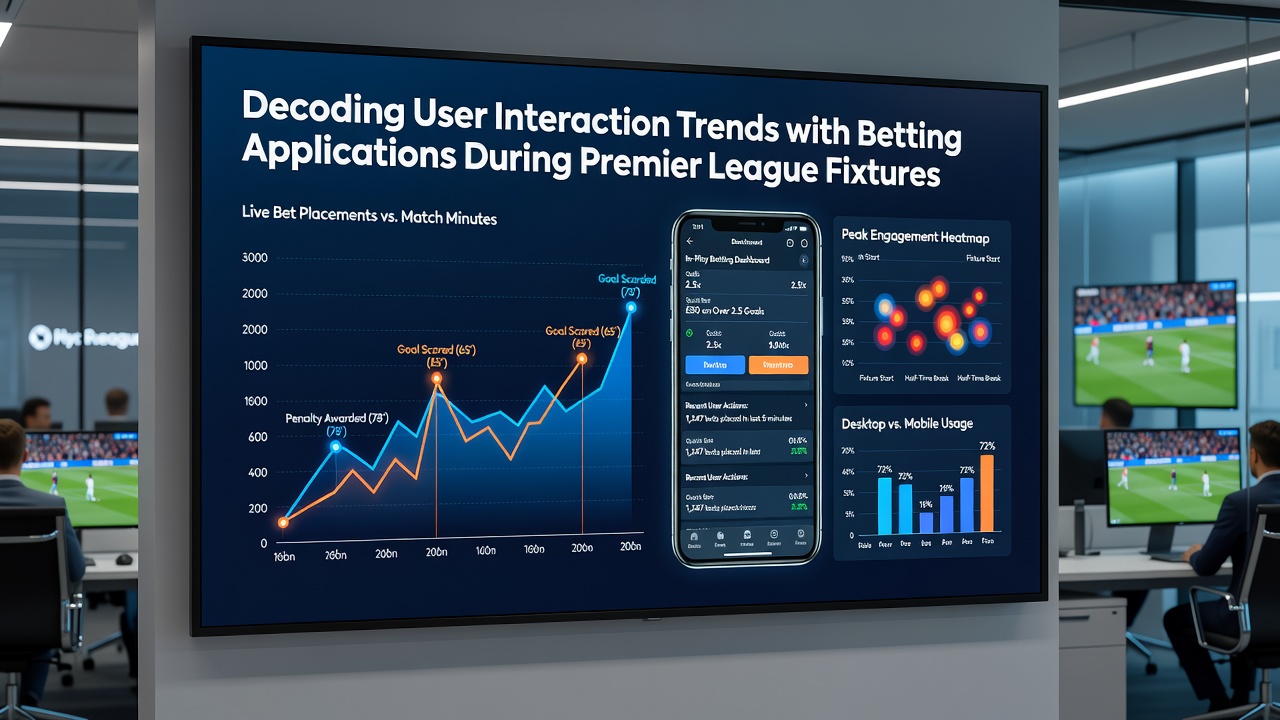
Take one dataset compiled by a European research consortium where mobile logs indicated that bettors using tablets maintained longer dwell times on statistical overlays than smartphone users, who favored streamlined bet-slip views. This distinction highlights how device choice influences the depth of interaction, with larger screens supporting more exploratory browsing of team form histories and head-to-head records.
Regional and Demographic Variations in Engagement
Evidence from operator reports across different territories suggests that urban users exhibit higher rates of multi-market activity during matches, often placing sequential bets on the same fixture. In contrast, suburban and rural cohorts tend toward single selections held until the match ends. A study released by the University of Sydney's gambling research unit examined similar football-related app data and noted parallel splits based on age brackets, with participants aged eighteen to thirty-four driving the majority of live in-play volume.
Yet the same analysis revealed that older demographics increased their overall session counts when matches featured extended stoppage time or dramatic comebacks, suggesting that narrative tension sustains engagement regardless of primary betting style. External factors such as weather disruptions or fixture congestion around international breaks also correlate with altered interaction rhythms in the collected metrics.
Impact of App Updates and Regulatory Context
Application developers rolled out interface refinements midway through the 2025-26 season that streamlined the process of switching between cash-out and additional bet placement, resulting in measurable upticks in completed transactions per session. A report issued by the Canadian Centre for Gaming Research documented comparable effects following similar design changes in North American sports betting platforms, underscoring how minor adjustments can shift user pathways across markets.
Those tracking compliance metrics add that responsible gambling prompts integrated into live flows have maintained steady activation rates without reducing overall fixture-related activity. This balance appears to hold steady as operators refine timing and placement of such tools based on observed behavior logs.
Conclusion
Patterns emerging from fixture-specific data continue to evolve alongside technological enhancements and broader viewing habits. Observers tracking these developments anticipate further refinement in how applications surface real-time information, particularly as multi-device usage becomes more common during live events. Continued monitoring across upcoming campaigns will clarify whether current navigation preferences persist or give way to new behaviors shaped by additional features and shifting schedules.